Secular Ruling Families show how it's done!
 This one's for the history books!

Friday’s Silver Massacre
Jan 30, 2026
Friday, January 30, 2026 will go down in history as the day silver experienced what statisticians would call “impossible”.
Let’s run through the superlatives, because they’re genuinely mind-bending.
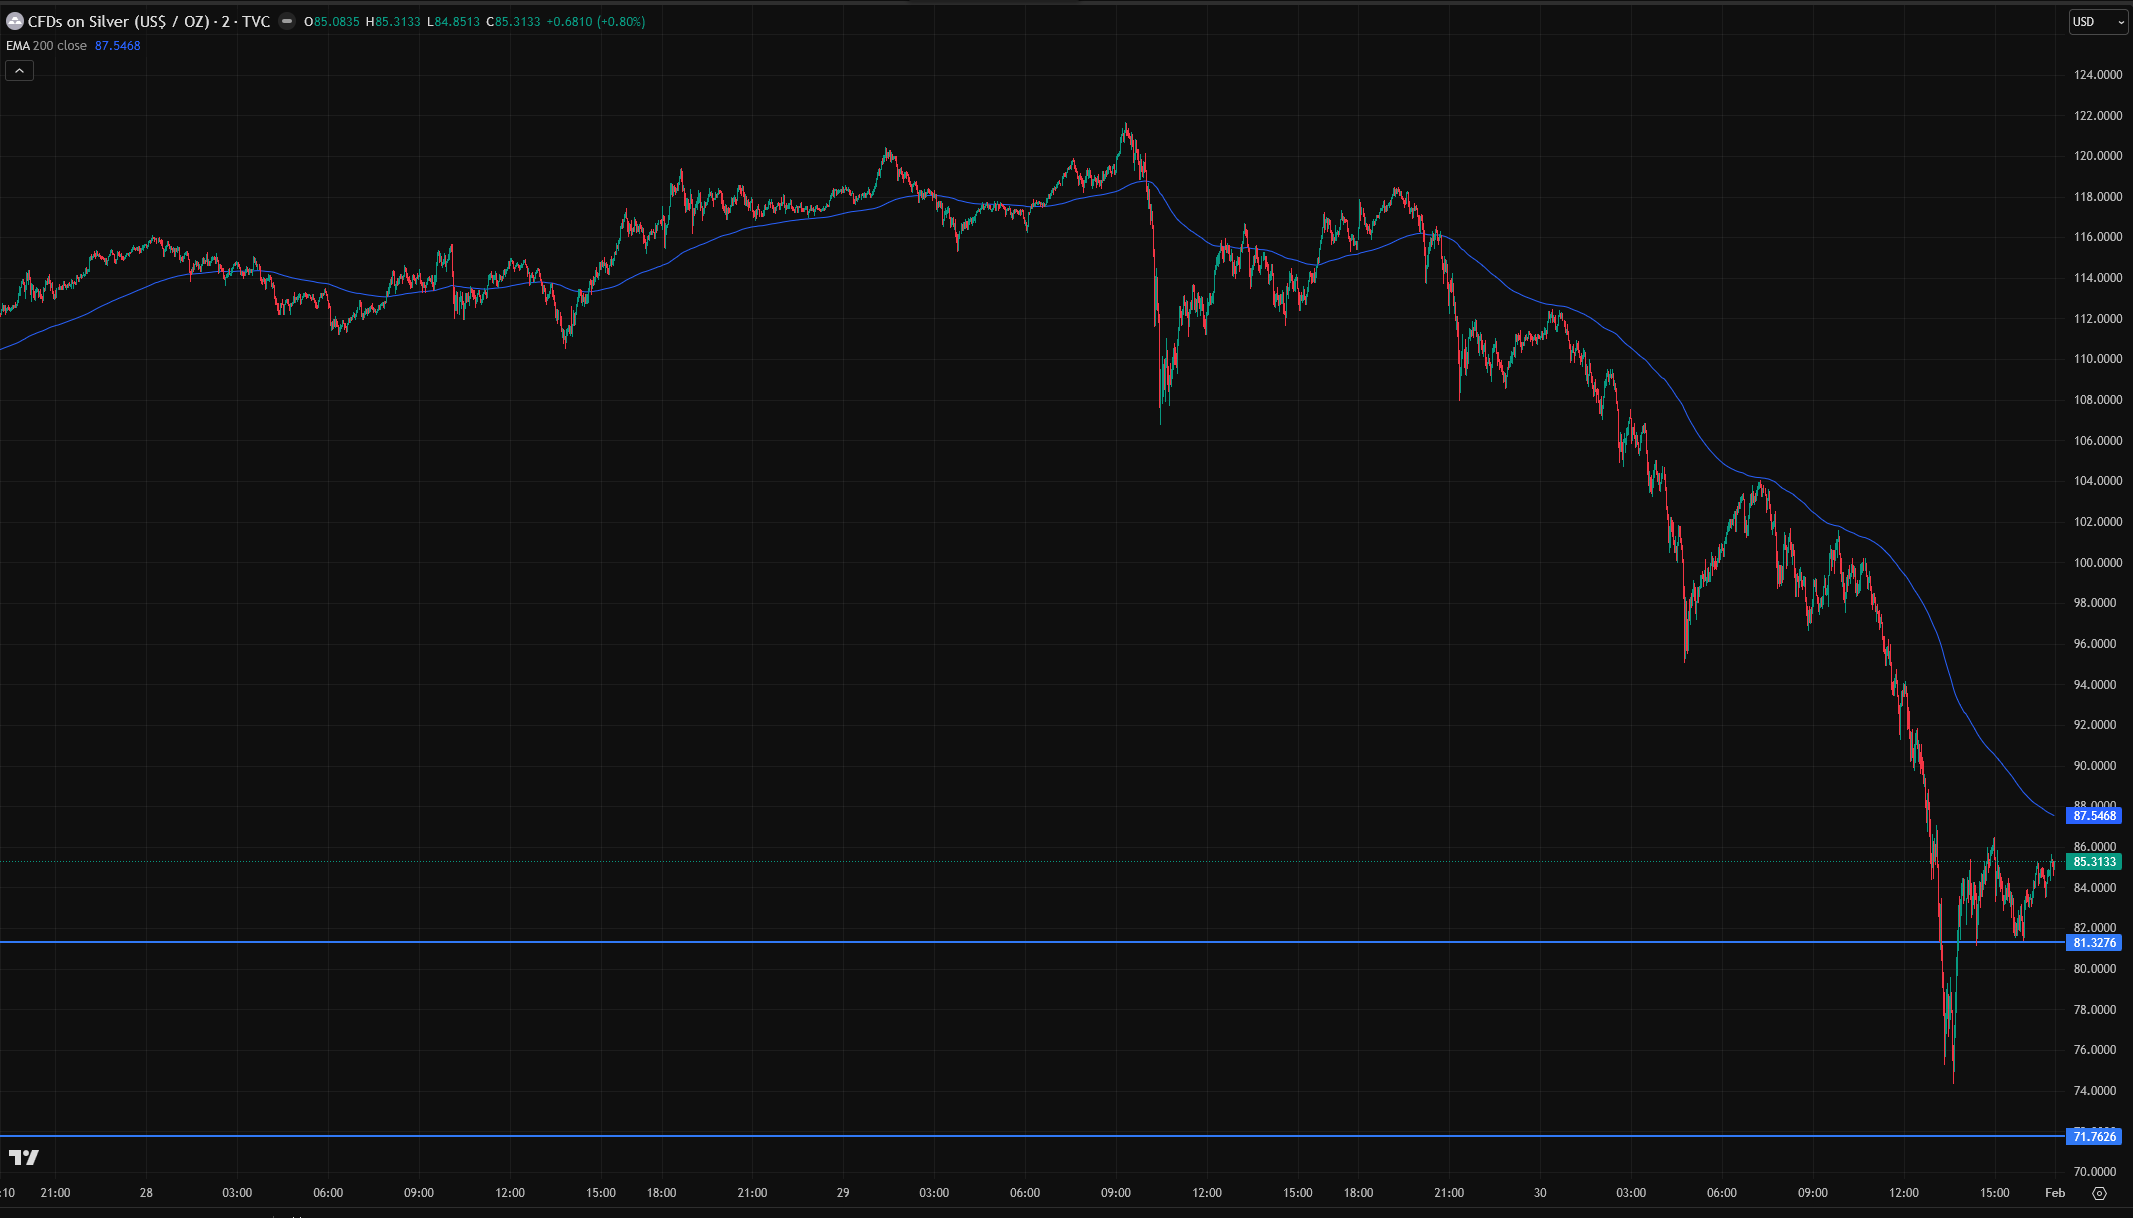
Silver crashed 31% in a single session. From Thursday’s all-time high of $121.78 to settlement at $78.53. That’s a 14-sigma event if you use a 10-year volatility baseline. For context, a 7-sigma event should happen once every 3 billion years. We’re talking statistical impossibilities - the kind of moves that only occur when something breaks.
But even against January’s already-insane volatility, this was a 6-7 sigma move. And if you’re not scared witless here yet… we’ve had multiple 4-5 sigma events this month alone. January 26 saw a 14% intraday swing - up 7%, then down 7% in hours. That’s a 4-sigma event. It happened on a Monday. Then Tuesday brought another 8% move. Thursday, another 6% swing before the all-time high.
When you start stacking 4-sigma, 5-sigma, 6-sigma events back-to-back-to-back, you’re not in a normal market anymore. You’re in a regime change. The volatility itself becomes the signal - something in the market structure has broken, and price is searching for a new equilibrium while leverage unwinds violently.
A 6-sigma event should happen once every 506 million days (when humanity was living in caves). We’ve now had four of them in January alone.
And boy, did something break.
Across all precious metals - silver, gold, platinum, palladium - roughly $7 trillion in market capitalization evaporated in 36 hours. Silver alone shed somewhere between $44 billion and $143 billion depending on whose above-ground inventory numbers you believe. The iShares Silver Trust (SLV) saw its worst day on record. Down 28-31% depending on the minute you checked. Gold had its steepest daily drop since 1983. This was worse than the 1980 Hunt Brothers collapse in percentage terms.
Let me repeat that: worse than 1980.
But something is wrong with this picture…
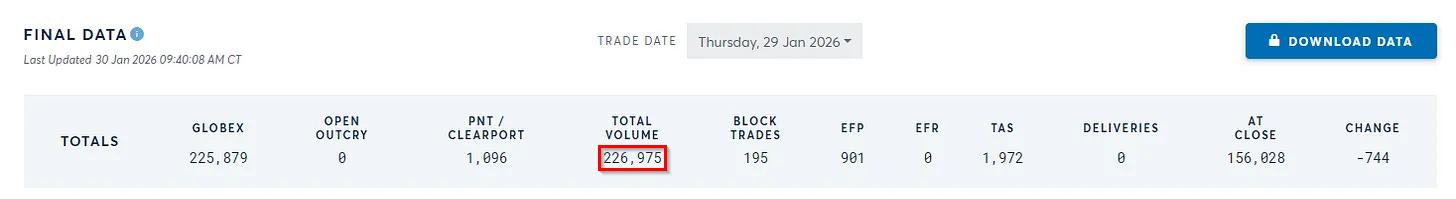
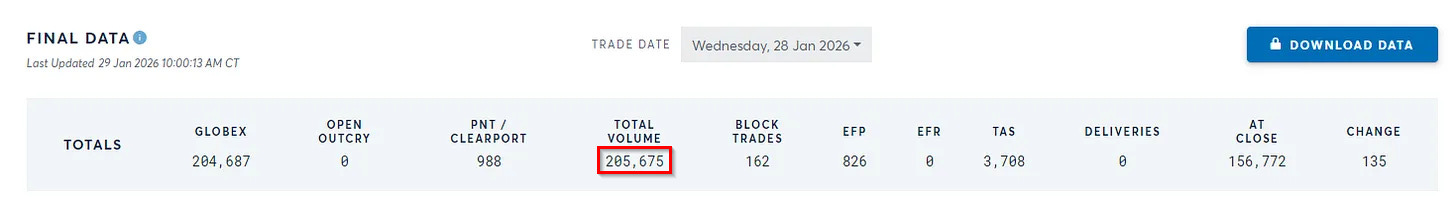
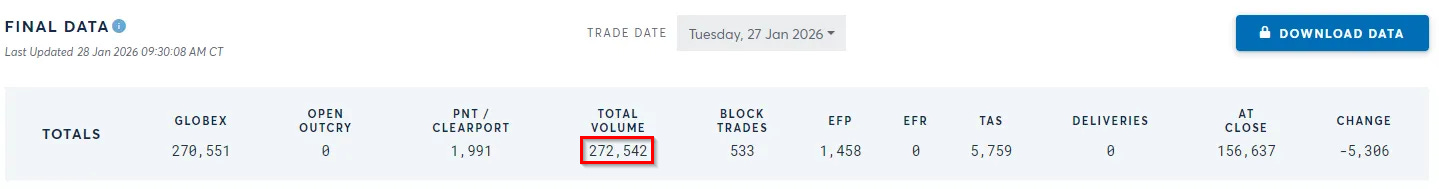
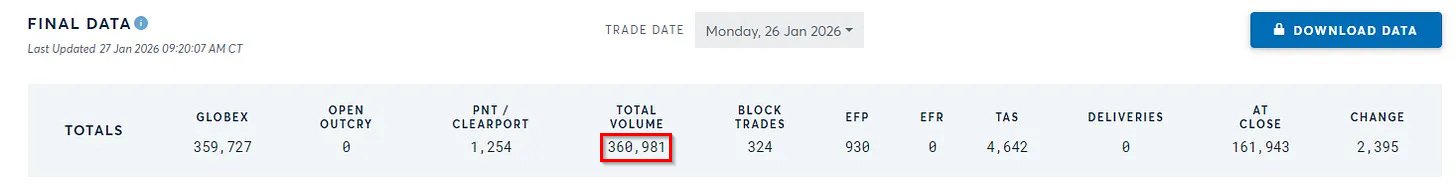
COMEX silver futures - you know, the actual exchange where physical silver is supposedly traded - saw volume of around 227,000 contracts. Compare that to January 27, just three days earlier: 272,000 contracts. Read that again. The “worst crash since 1980” happened on lower-than-recent volume in the futures market.
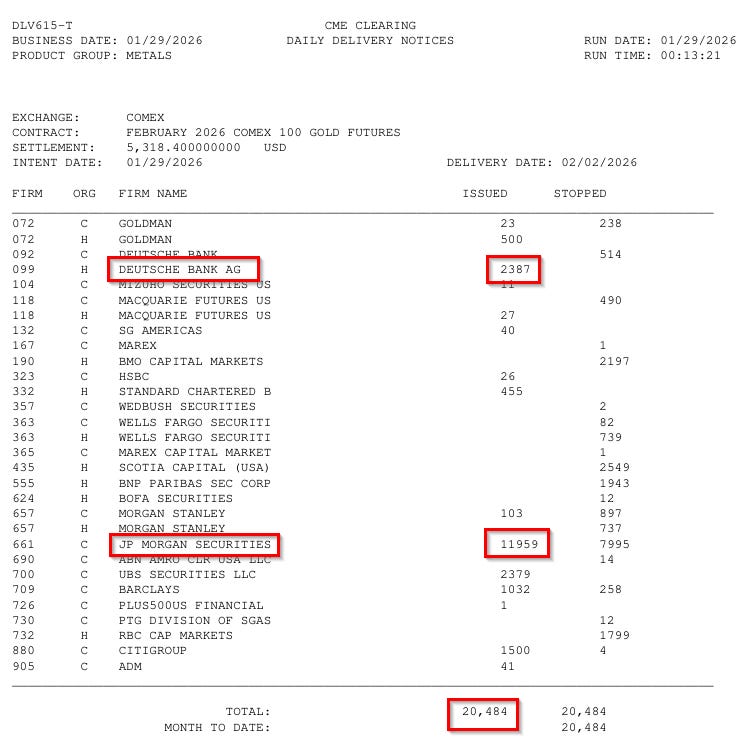
And then the delivery notices from January 29 - the day silver hit $121 - tell an interesting story. Gold saw 20,484 contracts (2 million ounces) in delivery notices. The largest single day of gold delivery activity in recent memory, right before a 12% crash.
Complete coincidence, I’m sure!
Thursday: record delivery notices at $5,300 gold. Friday: 12% crash to $4,700. Those deliveries settle next week at the lower prices.
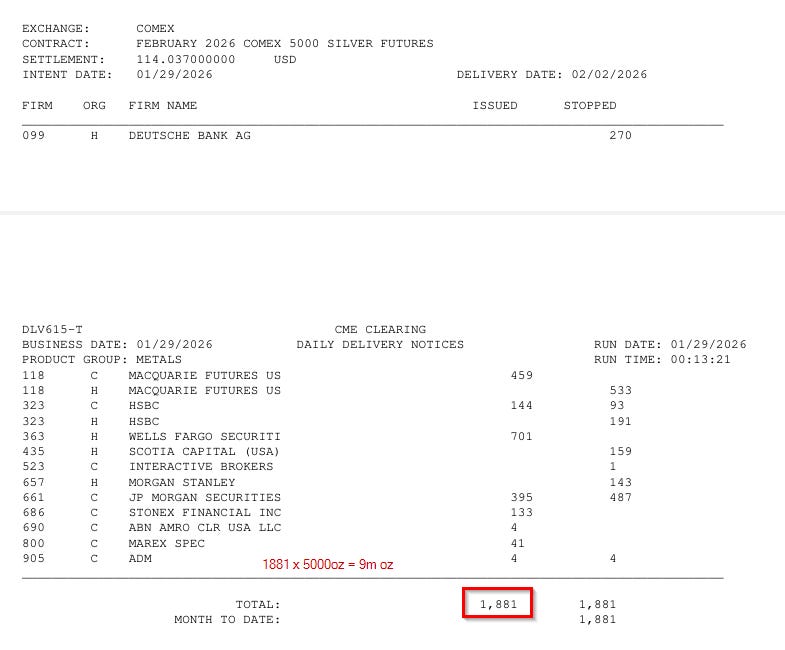
For silver? January 29 showed 1,881 contracts. But that’s before the massacre. The January 30 report - which covers the actual day of the 31% crash - isn’t out yet. Given what we just saw in gold, I’d suggest paying very close attention when that report drops. If silver delivery notices spiked on the crash day itself, well... draw your own conclusions.
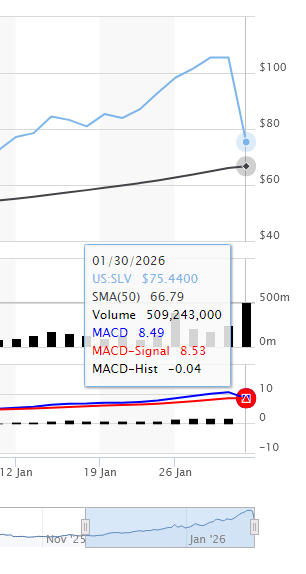
SLV? Oh, SLV went absolutely nuclear. 500+ million shares traded. That’s 13.2 times its average daily volume (Jan 26 was 393M). Dollar volume hit approximately $38 billion - matching the trading volume of SPY on a normal day. For a silver ETF.
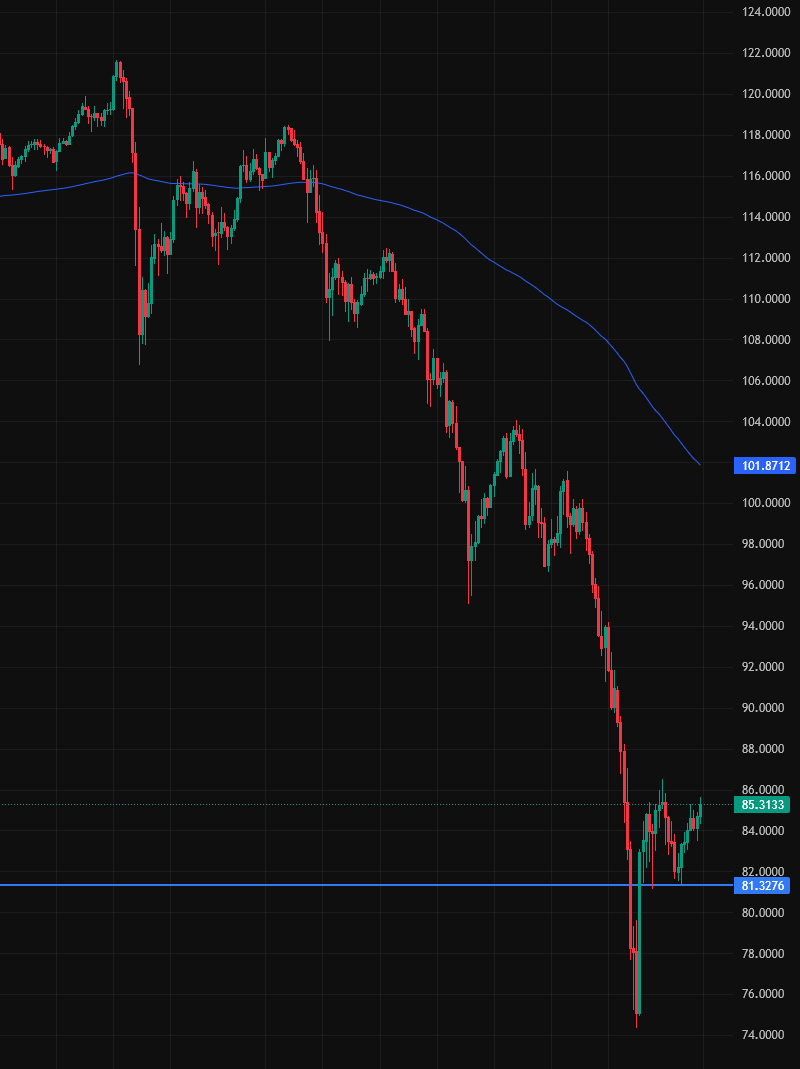
But I don’t believe for a second that this was a crash (yeah, I’m coping I guess). It was a grind. Look at the chart - this wasn’t panic selling triggering cascading stop losses. This was a mechanical, methodical descent from $122 to $76 over hours. Steady pressure. Never spiking down hard enough to trigger circuit breakers (which halt trading on 10% moves in 5 minutes), but never letting up either.
That kind of selling doesn’t happen organically. You can’t accidentally maintain 2-3% downward pressure every five minutes for an entire session without coordination and firepower. Someone had enough ammunition - or enough backing - to sell continuously for hours, pacing it carefully to avoid tripping exchange halts, never allowing a bounce, just grinding every bid into dust.
And unlike China’s ±10% daily limits, US exchanges have no maximum daily move for individual securities. As long as you don’t spike 10% in any 5-minute window, you can take something down in one session. No rules broken. Just relentless, institutional-grade selling with what looks like a target price in mind.
Panic would have triggered halts. This? This was controlled demolition.
So the futures market - where you can theoretically take delivery of actual metal - was relatively calm. But the ETF - where you own shares of a trust that owns silver - saw the most methodical liquidation ever recorded. Spot the problem yet?
What they don’t put in the SLV prospectus headline: shares can be created essentially at will. Authorized Participants (big banks, basically) can create new SLV shares by depositing silver. Or, you know, promising to deposit silver. Eventually. When they get around to it. The settlement process? T+2. Sometimes longer if things get messy.
So on Friday, when 505 million shares traded hands, how much of that was actual silver changing hands versus paper promises written on top of paper promises? We don’t know. We can’t know. That’s the design.
But we do know this: while SLV was cratering 31% in New York, the Shanghai Gold Exchange was quoting silver at $120-134/oz depending on the session. That’s a $42-49/oz premium over COMEX settlement prices. Shanghai has actual 15kg bars of 99.99% purity sitting in vaults. You want it? You pay the price & you’ll get the metal. No derivatives, no promises, no “authorized participants”.
And Shanghai says silver is worth $120+. New York says $78-85. Which market are you going to believe?
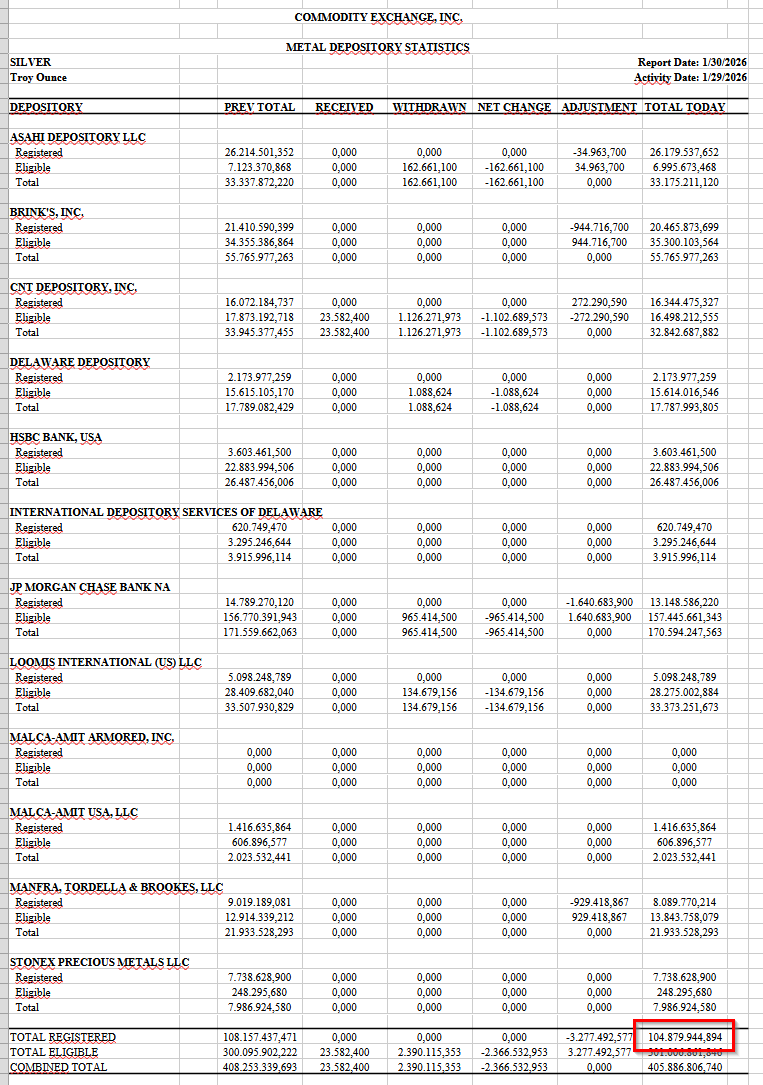
As I’ve mentioned in previous articles, COMEX registered silver inventory has been bleeding. January’s final tally: down 26% from roughly 142 million ounces to 104 million ounces. That’s 38 million ounces that walked out the door.
Let me get this straight: physical demand was so strong that a quarter of deliverable COMEX inventory disappeared, but the price needs to drop 31% in one day because Kevin Warsh got nominated to chair the Fed? Sure.
At $85 - or whatever the price is after finishing this article, we’re back to mid-January levels. Silver started 2025 around $30/oz - we’re still up 180% year-over-year despite Friday’s massacre. That vertical moonshot from $121 to $78 and back to $85 wiped out the late-month mania and probably every leveraged long position that existed.
The good news, if you want to call it that: all that leverage is gone. No more gamma squeeze, no more margin-fueled parabolic moves. Just whatever this market actually is when the paper games are dialed back. The bad news: Shanghai’s still quoting a $37 premium. India’s at $28 over spot. The physical market hasn’t gotten the memo about the “correction”.
COMEX says $85. Shanghai says $122. That spread - the widest in recorded history - is telling you something. Friday wasn’t a market correction. It was a liquidation event in the paper market while the physical market said “not interested in your prices, thanks”.
You’re watching two markets diverge in real time - one that trades promises, and one that trades metal.


Comments
Post a Comment