On the impact of the vaccines on non-covid deaths [Part 1]
How can the vaccine affect those not vaccinated?

On the first of November a new data set came out — deaths by vaccine status for England. Despite all the daily briefings on covid deaths and vaccination numbers, any data on outcomes by vaccine status is hard to come by so this data release is certainly of interest.
I’ll start off by saying that deaths data are never nice to explore. What you see are numbers, but each number represents a family filled with sadness and pain. I’m not isolated from this — a good friend of mine died in January and he will be one of the numbers making up the data I’ll be exploring. My condolences to anyone else who has suffered a loss in this time.
But we can’t let our emotional state get in the way of checking the data, so let’s get on with it.
First of all the main document. This is rather long but gives surprisingly little information; the main findings are in Table 1:
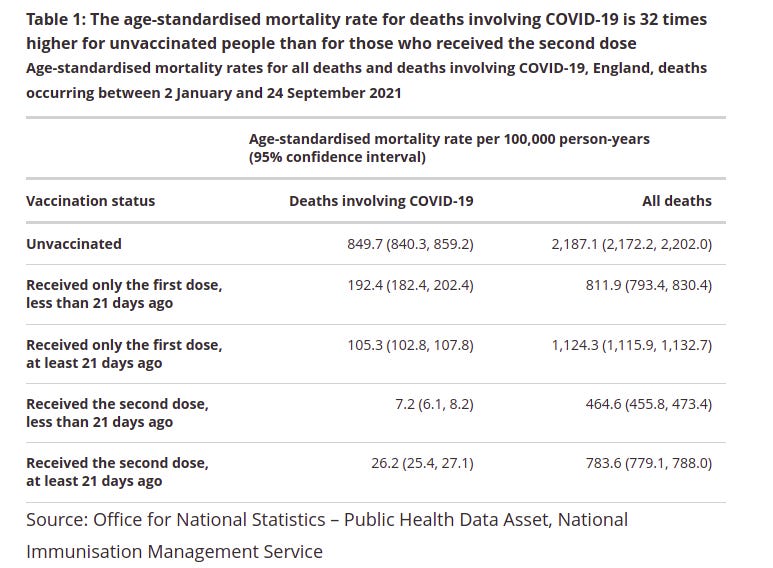
That seems clear enough. The vaccines reduce mortality with covid by about 30 times. Oh, and the vaccines also reduce mortality from all causes by about 2.5 times; this seems a bit odd, but perhaps it is simply due to the covid deaths being part of the all-causes deaths? Hmm. I’m not entirely convinced — I think we need to explore this further. Time to have a look at the spreadsheet holding the underlying data.
The spreadsheet containing the data supplied by the ONS is easy enough to explore, with nice tables laid out in a convenient fashion… Except for Tables 3 and 4, the death rates for covid and ‘all causes’ by age range; these two spreadsheets are not laid out in a convenient form and are difficult to interpret by eye — this gets my spidey senses tingling… are they trying to hide something? Lets look deeper into these data
The first thing I want to get out of the way is deaths with covid by vaccination status. Here’s the graph for those over 80 (other age groups look similar).
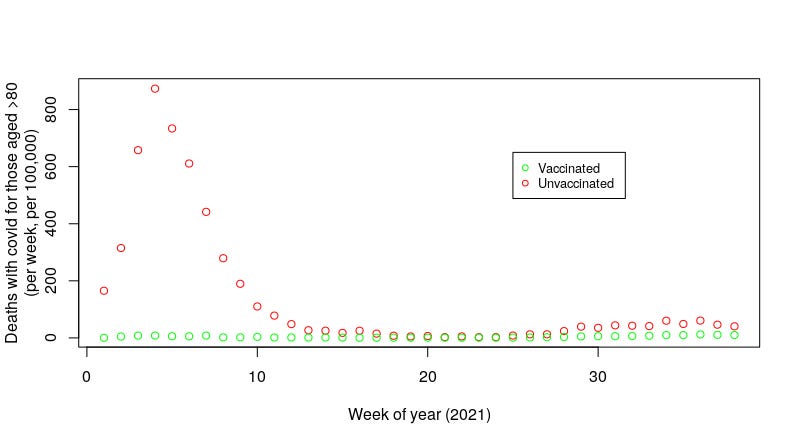
That’s pretty clear — lots of deaths in the unvaccinated particularly during the winter period, hardly any in the vaccinated — the vaccines appear to work well. Great. Now that’s out of the way.
The deaths data with covid for the vaccines is all over the internet; what I’m really interested in is the non-covid deaths by vaccination status. Handily, the spreadsheet gives us a way to find these out — as it gives both total deaths and with-covid deaths we can subtract one from the other to get the non-covid deaths. I’m going to say this once more, because it is the fundamental point of the analysis I’m going to show here — we’re going to be considering deaths from anything other than with covid, and as ‘with covid’ is defined in the data set as those dying within 28 days of a positive covid test or where it is noted on the death certificate, non-covid deaths are those where there isn’t a positive test within 28 days or where covid isn’t mentioned on the death certificate. I’d note right now that these deaths will involve all sorts of causes, including road accidents, suicides and rare genetic conditions, but the main causes of death in this group will be the usual suspects — heart attacks, strokes, cancer and end-of-life infections.
I’ll start off with a graph of non-covid deaths in the unvaccinated vs double-vaccinated, for those aged over 80 (as in the graph above for covid deaths).
Well — let me start off by saying what I expect to see. The vaccines clearly can’t influence the non-vaccinated, and we’re talking here about non-covid deaths which you’d imagine wouldn’t be influenced by a covid vaccine either. Thus I expect to see the unvaccinated and vaccinated curves being broadly similar, with perhaps a tend for lower deaths as we move into spring and summer — the fact that there are more deaths in this age group in winter is undeniable.
And the graph for non-covid deaths in those aged over 80 shows…
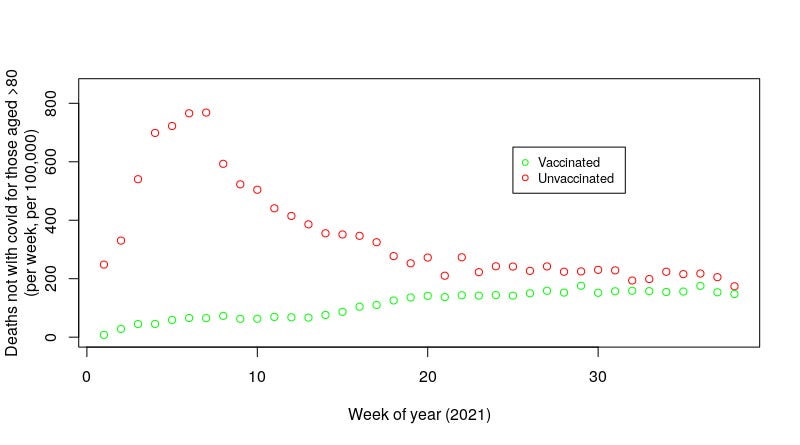
Oh. That clearly isn’t what I was expecting. What we have here is something very different:
The vaccines appear to lower the death rate for non-covid causes. It has been suggested that the vaccines have a positive health benefit, and on the face of it that seems to be supported by the data, as unlikely as it sounds.
But, very strangely, the vaccines appear to substantially increase the risk of death in those not vaccinated, for non-covid causes. How can this even be possible?
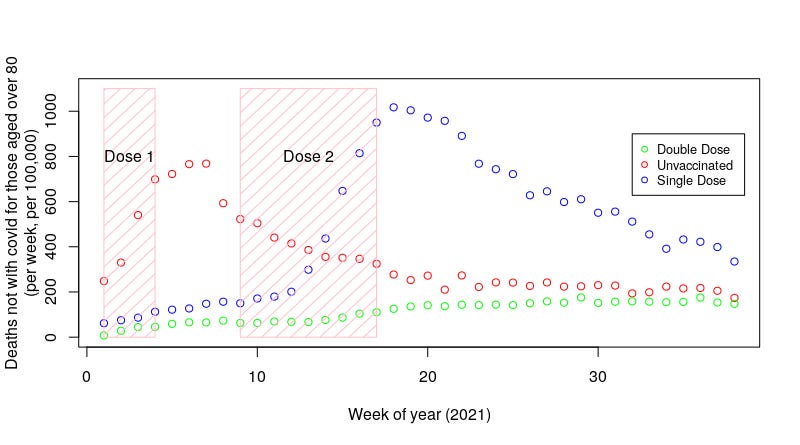
Let’s look more carefully at these data — and I’ll bring the data for deaths after the first dose as well and include an indication of when the doses were, just to help things along:
Well, are we actually going forwards here? I think some analysis is in order:
First of all, note where the ‘Dose’ shaded sections are. In these series of graphs I’ve plotted the period approximately covering the time between 10% of those over 80 having received their dose of vaccine to 90% receiving their dose, but for this graph the data starts in the first week of 2021, at which point approximately 20% of those over 80 had had their first dose of their covid vaccine.
The graph above looks as though it is suggesting that as the first dose of the vaccine gets rolled-out the death rate from causes other than covid increases in the unvaccinated — the blue dots (those only with a first dose) are low and the red dots (those unvaccinated) rise sharply. Hmm — this is difficult to explain. But maybe covid is killing people without leaving any trace? That’s certainly difficult to believe given how low the bar was set for a covid death — if anything it should be the other way around, with people dying of all sorts of causes while happening to have tested positive for covid.
And what about the fate of the single jabbed? In the data we see a sudden rise just as they start delivering the second dose of vaccine. That’s weird (remember — these are deaths in the individuals not given the second dose).
I think we need to see the bigger picture — let’s look at the fate of some other age groups. I’ve plotted the same data but for those aged 70-80:
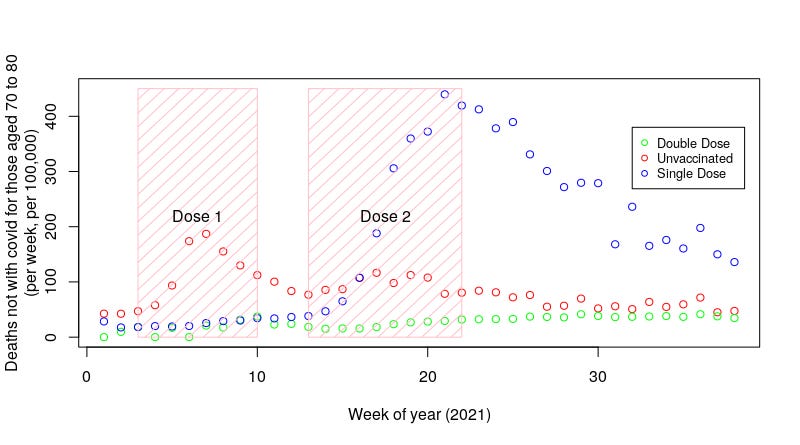
And for those aged 60-70:
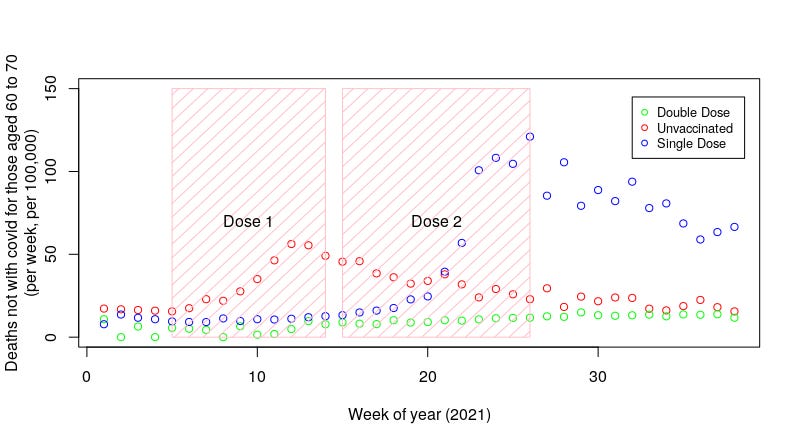
Now that’s really interesting. The increase in non-covid deaths seem to mainly be correlated with the progress of the vaccination campaign in the relevant age group, with effects seen both during first dose and second dose.
A hypothesis to explain these data
What we’re seeing in the data is clearly not ‘an increase in non-covid deaths in the unvaccinated’.
I suggest that what we’re seeing is the impact of those least likely to die being vaccinated, with the ones unvaccinated being a mix of those choosing to not get vaccinated, and those who are likely to die in the following weeks and months. As the vaccination campaign gets underway those most likely to die get concentrated into a smaller and smaller group of people, increasing the relative rate of death in the relatively small numbers of unvaccinated.
Thus I suggest that what we’re seeing isn’t an increase in deaths in the unvaccinated, but the movement of the ones least likely to die into the vaccinated group.
But do we know in advance who is going to die? Well, some deaths just come along suddenly and without much in the way of warning — the road accident, the suicide, the heart attack on the golf course — but the majority of deaths amongst the elderly are in those that are very frail and/or with late stage dementia, and in all age groups terminal cancers are responsible for a significant number of deaths. For these very ill people I believe that there was a consideration during vaccination that they would receive little benefit from vaccination, and that the side effects of vaccination might significantly reduce their quality of life and might even directly result in death.
So, it would appear that for each of these age groups (60-70, 70-80, 80+) we see the following sequence of events:
Before the main vaccination campaign for that age group the majority are unvaccinated and thus most deaths occur in this group. Because the unvaccinated group is so large the background rate of death is low (we don’t see so much this in the 80+ group because the proportion vaccinated was already over 20% when the data series starts).
And, before the main vaccination campaign started for each age group, those vaccinated included large numbers of younger healthcare workers who weren’t likely to die. This kept the death rate in the vaccinated relatively low. This per-main-vaccination group also included some vulnerable people, but tended to not contain those actually in their last weeks of life.
As the vaccination campaign started for the first dose those most likely to die were spared from vaccination. This concentrated those considered by medical staff to be most likely to die into the unvaccinated group, while leaving the vaccinated group with relatively low numbers who were considered to be likely to die.
Some who were rather ill with chronic conditions, but not so close to death, were given the first dose of the vaccine but had become too ill by the time the second dose became available. Or, perhaps, their physician decided that their reaction (side-effect) to the first dose had been too great and that a second dose was not recommended. Either way, at the time of the second dose we see a similar concentrating of those most likely to die into the first-dose-only group, while again leaving the two-dose group with relatively low numbers most likely to die.
Note that there are relatively low numbers of people in these older age groups who only had a single dose; it is clear that some people decided to not accept any covid vaccination, but relatively fewer took their first dose but then decided to forego their second. This is likely to be the reason why the deaths per 100,000 is higher in those only having a single dose — it isn’t that there are more deaths, but that there are fewer of them and the low numbers of deaths from those who were likely to die from existing conditions are more noticeable.
By the end of the data series, say beyond week 30 (August to September), we see the non-covid death rate for the double vaccinated and unvaccinated trend towards the same rate. That is, it appears that there isn’t really any impact of vaccination on non-covid deaths — it was all just an illusion caused by choices being made as to who was vaccinated and when.
But we do see a maintained higher death rate in those only having had a single dose. Again, note that this group is relatively small; the actual death rate is low, it is just that the group contains those most ill with serious chronic conditions, and that there are fewer single vaccine dose non-ill people to bring the average down.
So, let’s go back to the summary table (Table 1) from the deaths by vaccine status report:
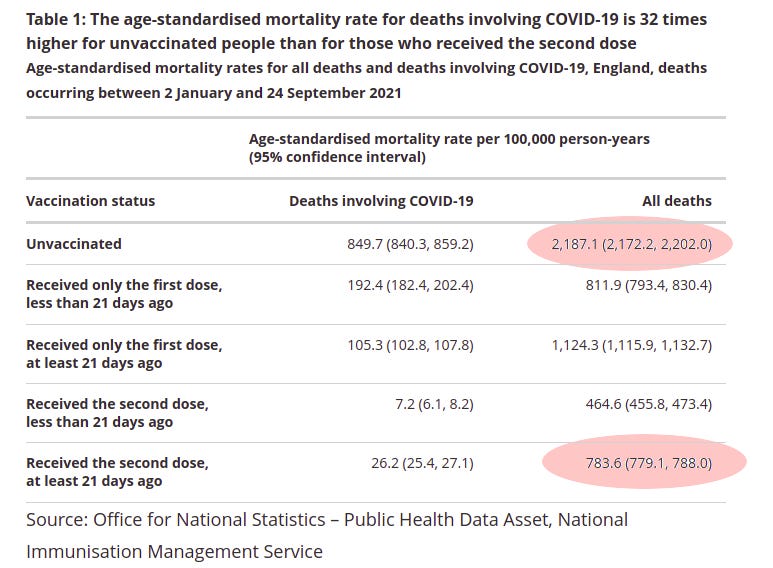
I’ve highlighted the values of concern. The suggestion has been that this indicates that the vaccines are working to improve overall health in the vaccinated. The data that I have presented here suggests instead that a large part of the difference is merely because they left unvaccinated those most likely to die, and because this group had relatively low numbers in it, the all-causes death rate in the unvaccinated was greatly exaggerated.
But now I’m thinking — the definition of death with covid was very broad… Perhaps this effect has had an impact on covid deaths as well? I’ll discuss this in part 2.


Comments
Post a Comment